5 posts
Research Software Engineer with a passion for visualization, computer graphics, and data storytelling.
Maarten van Meersbergen·Jun 7, 2021 When conducting research, the data collected can in itself be exciting and meaningful, but when it is presented as spreadsheets or bullet points it can be too borin...
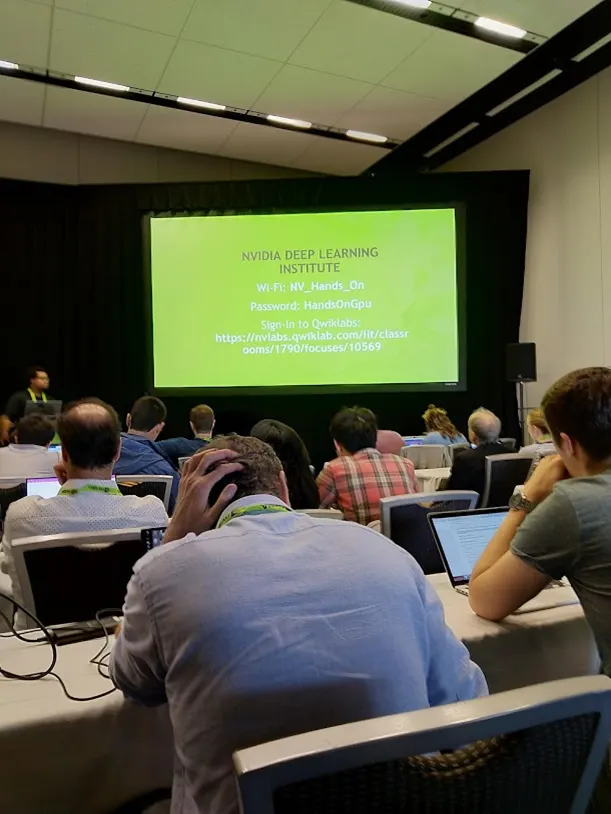
This year I was lucky enough to be able to travel to the city of Vancouver to attend the SIGGRAPH 2018 conference, the annual conference on computer graphics convened by the ACM SIGGRAPH organization...
The StoryTeller application gives you a different perspective on the news A screenshot from the StoryTeller application. Shown here is a co-participation graph for entities that participate in events...
With some help, its algorithms can be trained to find you the good stuff A decade ago, my favorite TV channel used to be the Discovery channel. I spent hours watching shows like How it’s made, Mythbus...
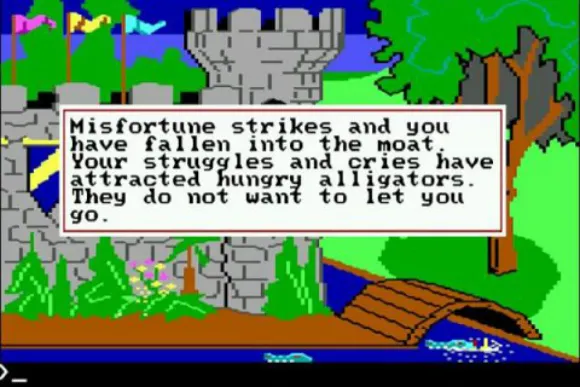
If you know me at all, you have probably heard me talk about computer games at least once. Games are such a huge part of how I spend my free time, it is hard for me to not talk about them in the best...
Search the archive