Bart Schilperoort·Apr 22, 2025
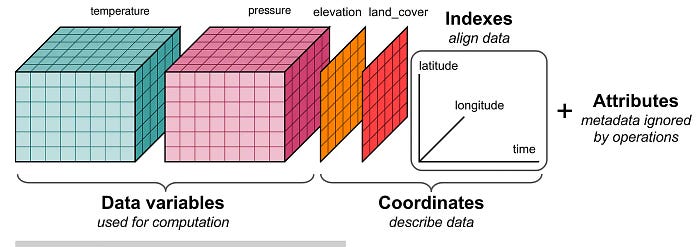
Keeping your scientific data files small
Peter Kalverla·Dec 10, 2024
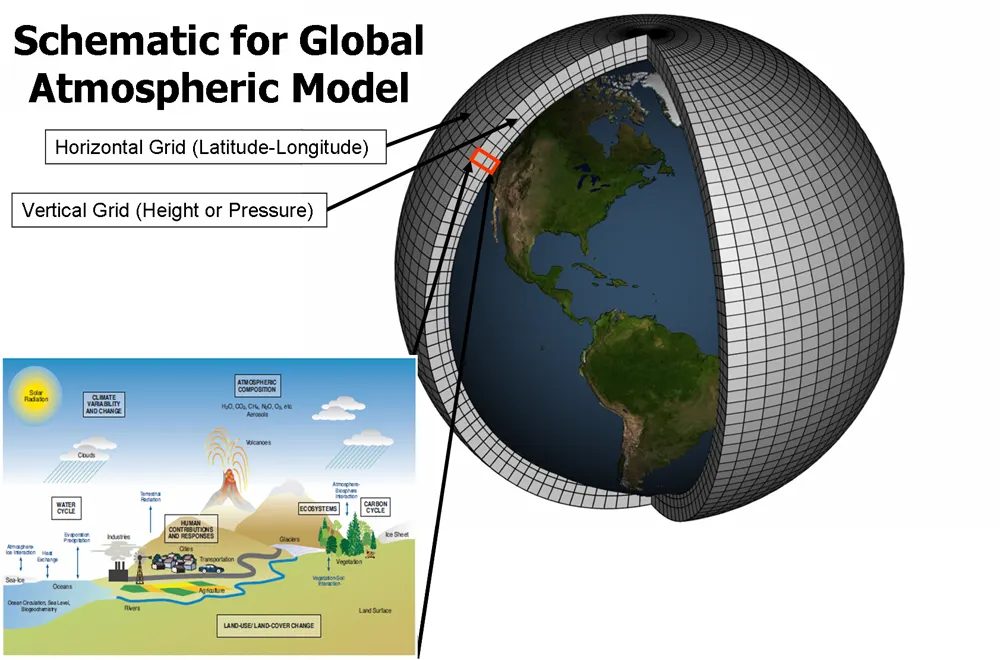
Amsterdam as seen by a weather model
Peter Kalverla·Jun 21, 2024
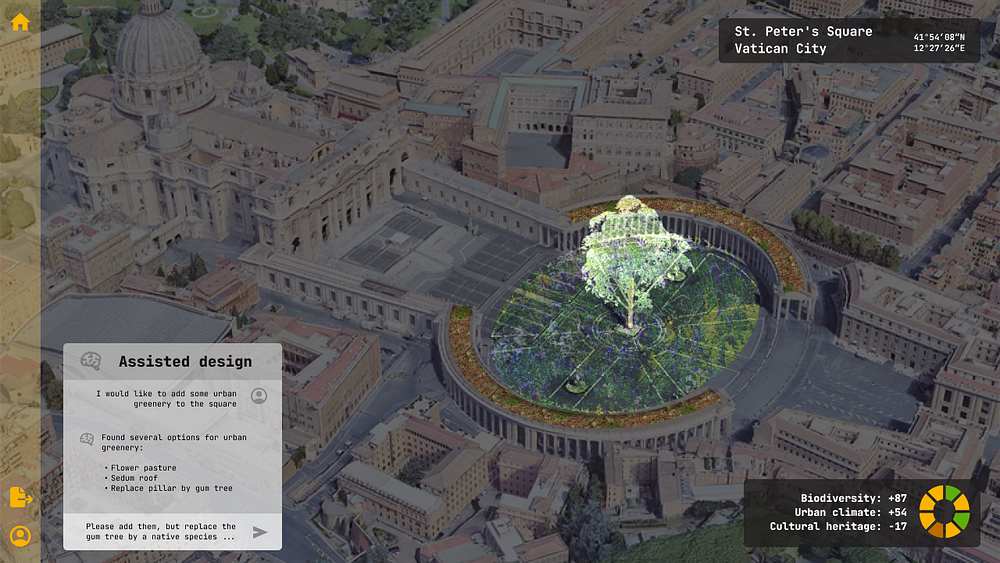
Henry, the City Tweaker
Peter Kalverla·Nov 21, 2023
Cracking the (moisture) tracking code
Peter Kalverla·Oct 5, 2023
Analysis-ready climate data with ESMValCore
Peter Kalverla·Sep 11, 2023
ESMValTool: Recipes for solid climate science

Peter Kalverla·Aug 21, 2023
Lilio — a calendar package for machine learning with time series data
Stef Smeets·Jun 20, 2023
Reduce, reuse, recycle: save the planet one GitHub action at a time
eScience
Gijs van den Oord·Dec 14, 2021
The new IPCC assessment report: stakes have been raised
Peter Kalverla·Sep 21, 2021
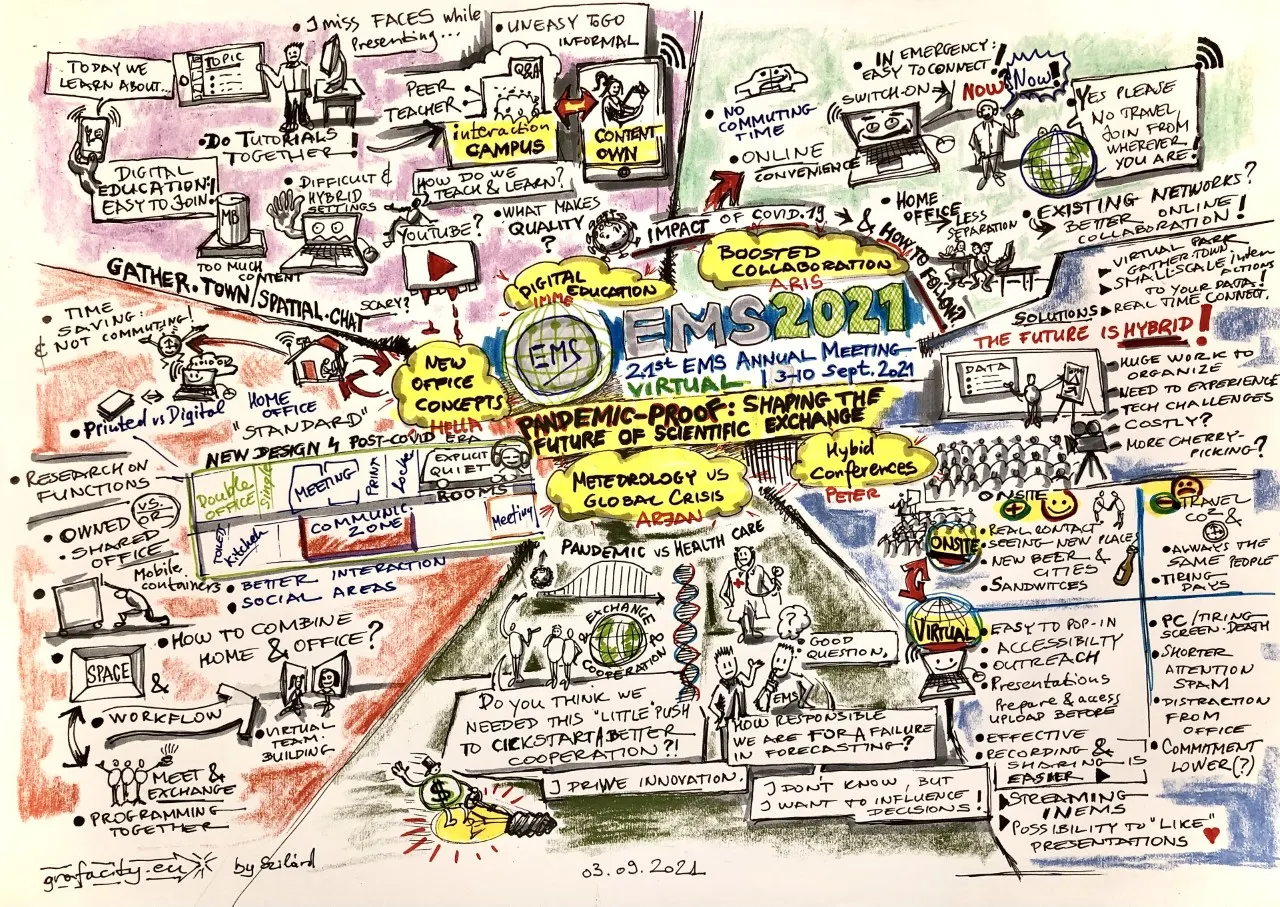
Pandemic-proof: shaping the future of scientific exchange
Peter Kalverla·Sep 20, 2021
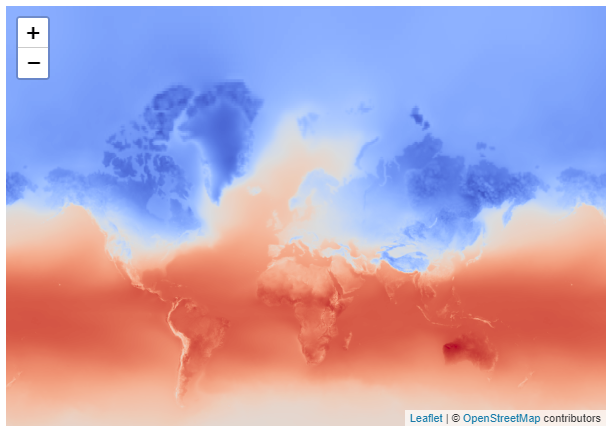
Plotting gridded data on a web map: Python and/or Javascript?
Maarten van Meersbergen·Jun 17, 2021
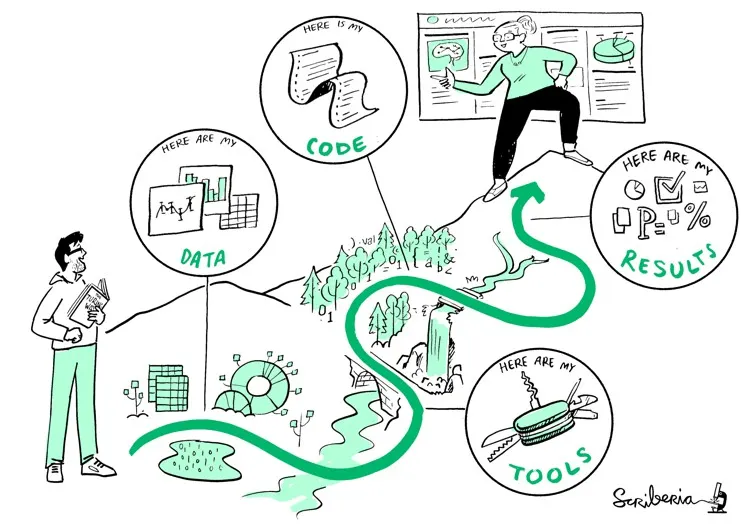
Visual Storytelling for data science
eScience
Peter Kalverla·Mar 25, 2020
6 months of eScience: 6 lessons worth sharing
Ronald van Haren·Feb 5, 2019
fairifying ewatercycle
eScience Editorial Team·Jul 11, 2018
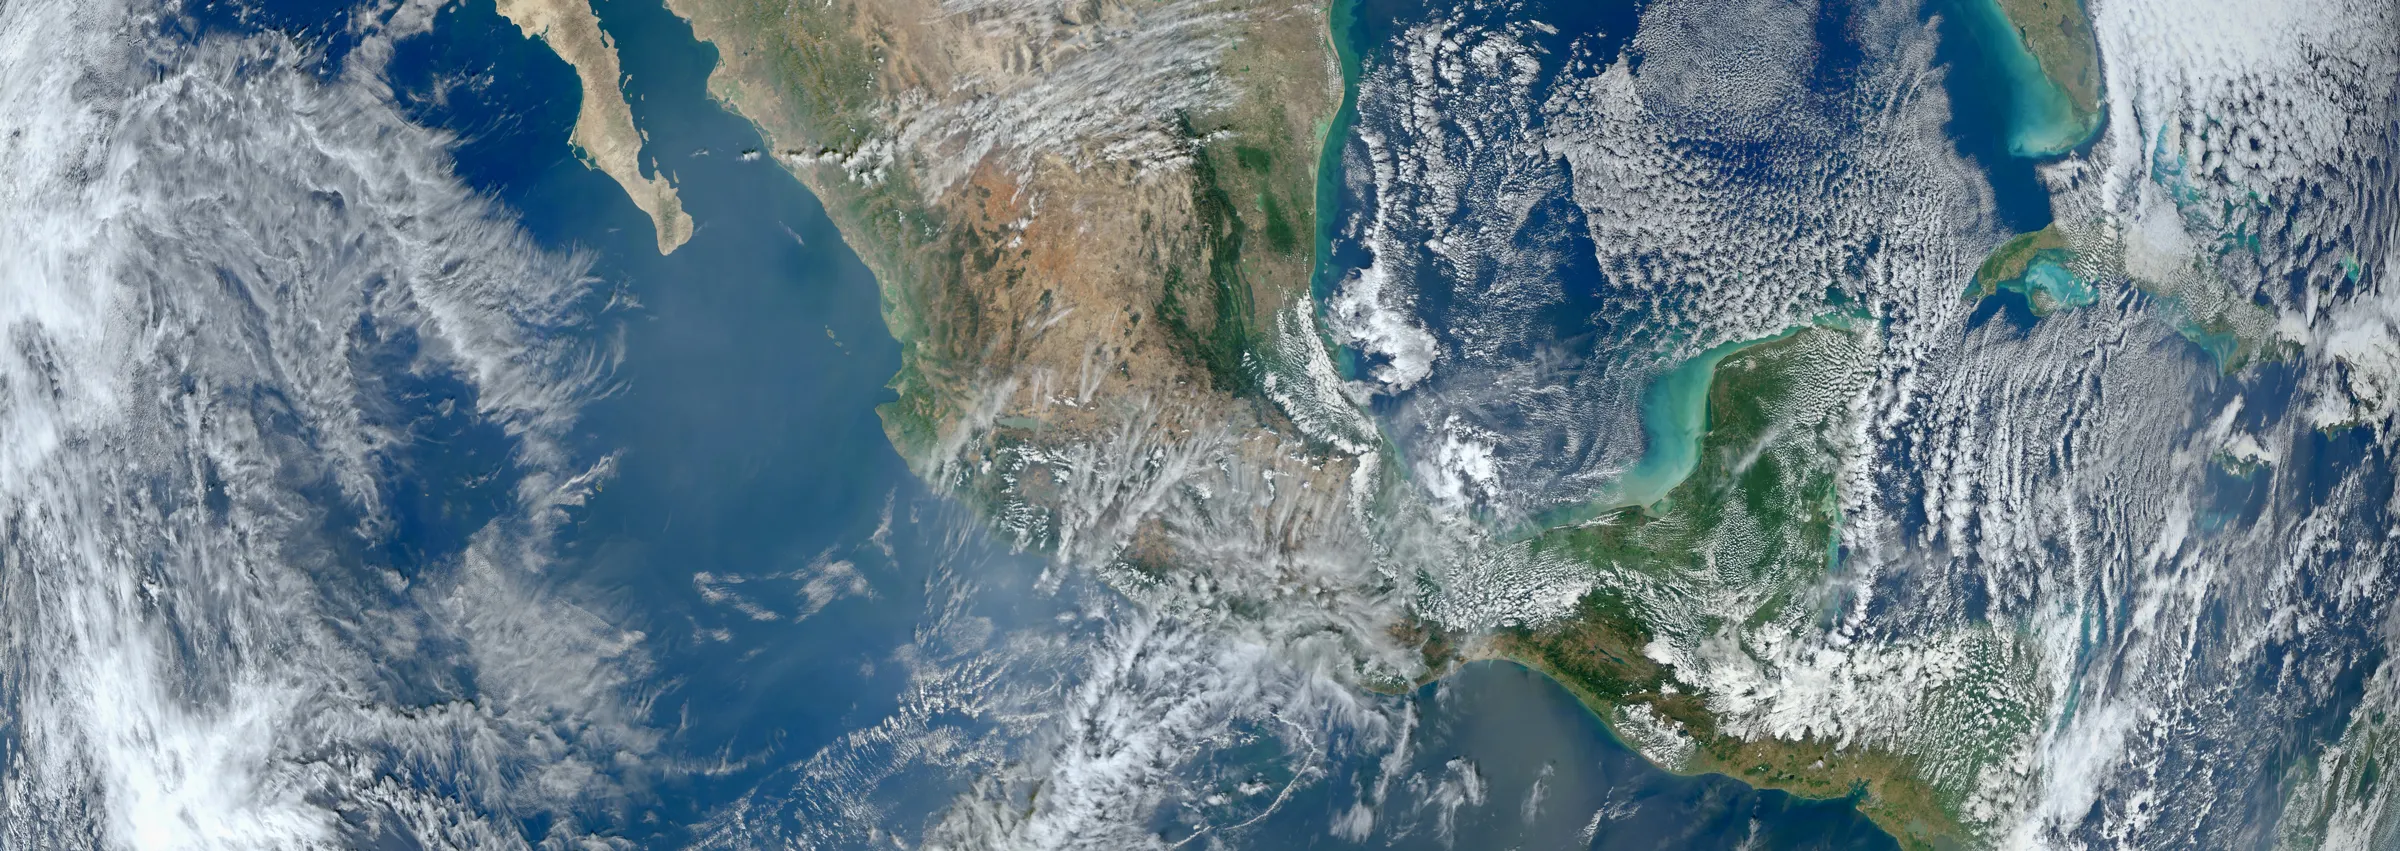
the end of theory for earth sciences
Ronald van Haren·Aug 23, 2017
predicting temperatures in your street
eScience Editorial Team·Jun 21, 2017
what is the impact of visualization on science