How is the end of daylight saving time going to affect me?
It happens every year. Twice. And it can be pretty annoying. I am talking about the clock shift to re-adapt our schedules to wintertime or summertime. But did you know that this October 25 may be the last time this happens? Well… at least if you are reading these lines from Europe.
Farewell to the (two) clocks
The European Parliament decided to stop the practice of "spring forward, fall back". This decision has been backed by a public consultation to 4.6 million Europeans, 84% of them were in favor of stopping the biyearly clock readjustment.
The reasons to abandon the traditional clock readjustment are manifold. Most of us agree with the most obvious of all: it causes a couple of days of annoyance to get used to the new timetable. There is, additionally, some controversy about how much energy is saved, plus some evidence about an increase in car crashes in the days after a clock change.
The members of the European Union have been asked to choose between winter and summertime clocks, and stick to their choice during the whole year. The deadline for this decision is April 2021… and sticking permanently to one of these clocks is not an easy choice.
From a sociopolitical point of view, one of the obvious concerns is the possibility of causing a de-synchronization between countries that currently share the same clock. It would not be very convenient, for instance, to use different timezones in The Netherlands and Belgium. Efficient coordination between the EU members will certainly require communication and diplomacy.
But there is an even deeper problem. Changing the clocks reduces the undesirable effects of an astronomical phenomenon: that of the variability of sunlight hours during the year. To make it even more difficult, this variability depends not only on the day of the year but also on the location on Earth.
Luckily, the study of the relationship between daylight duration, position, and date is one of the oldest objects of study. There are some early references in the Babylonian time, the topic was already covered in Ptolemy’s Almagest, and it is part of the everyday life of sailors since, at least, the publication of the first nautical almanacs in the 1700s. Nowadays, all the knowledge we need is just a few clicks away.
Daylight charts and how to read them
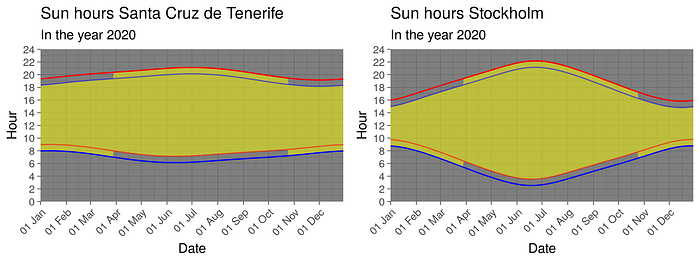
The easiest way to visualize this kind of information is by using a daylight chart. They look like this:

Nowadays, quick and simple access to astronomical databases makes it easier than ever to simulate daylight charts at any point in the world. In particular, I wrote this code in R to generate such diagrams. It can be run as an interactive applet, either in Shinyapps or locally, to query for any city in the EU with a population over 100k. Additionally, I precalculated a collection of daylight charts for Dutch, Spanish, and other European towns with a population over 100k.
By playing with these diagrams we can learn some lessons about the reasons for using two clocks, and we can also simulate possible new scenarios. For instance, we can compare the daylight charts of Barcelona with clock shift and with permanent summer clock:

The three possible scenarios can be visualized in a more compact way using a single chart with different colors:

Just for fun, we can explore the effect of latitude (the position in the South-North line) by, for instance, comparing two of the southernmost and northernmost big towns in the EU:

Longitude, that is, the position in the direction West-East, also plays a role. This is the direction of the Earth’s rotation and, thus, we can imagine the sunrise “traveling” through it. Indeed, this the reason we have different timezones.
Timezones are decided not only due to astronomical considerations but also due to commercial and political ones. Lots of them are actually wider than the distance the sun covers in one hour, and this causes interesting effects.
Take a look at the map below. It shows the night advancing over Europe the day of the September equinox, together with the European timezones. Do you see something strange?

The Central European Timezone, for instance, is huge. The sun takes more than two hours to cover it. And remember, for all the people who live there, the clock shows the same time.
Let's imagine two Europeans, Mateusz and Breixo. Mateusz lives in Lublin, in the East of Poland, and Breixo lives in Tuy, in Northwestern Spain. They both leave the office where they work, simultaneously, when the clock reads 18:00, but their experience is very different. For Mateusz, 18:00 is almost night, while for Breixo it will still be clear daylight for two more hours. Something similar will happen with the sunrise: it will happen roughly two hours earlier for Mateusz than for Breixo. And all of this happens although their clocks are synchronized (actually, it happens because their clocks are synchronized).
Interestingly enough, Vânia, who lives in the Portuguese town of Valença do Minho, only one kilometer away from Breixo, is in a different timezone. So her clock will read one hour less than that of her neighbor Breixo when the night arrives, simultaneously, at both towns. Pretty confusing, right?
We can see also these effects on our diagrams. In the one below we see an example with two of the most occidental/oriental cities in the CET timezone:

A well-informed decision is a good decision. The socioeconomic aspects of this problem are pretty difficult to predict, but the astronomical ones, on the contrary, are almost as predictable as the movement of a clock. Whenever we can, let’s base our decisions on data.
Acknowledgments
The final version of this short essay was greatly improved by the suggestions and comments of Zeger van der Sterre, Lourens Veen, Stefan Verhoeven, Patrick Bos, Sonja Georgievska and Maarten van Meersbergen.

